Summary: Latitude vs. "x"
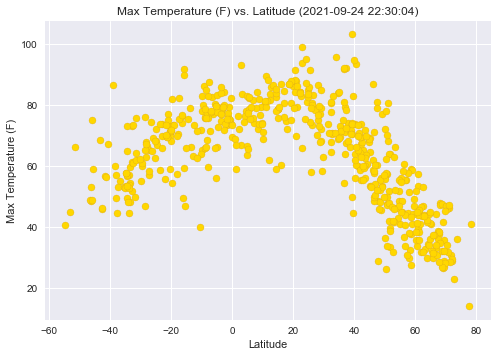
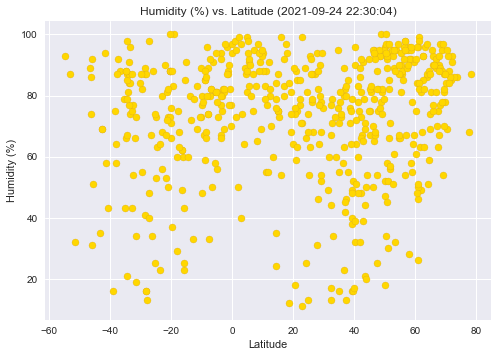
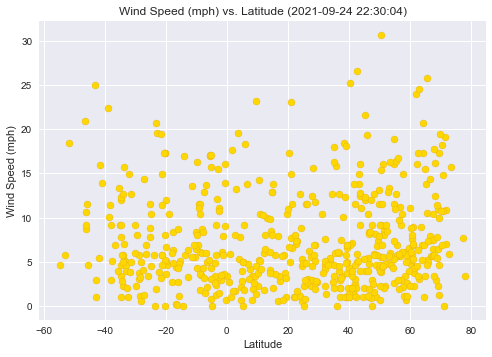
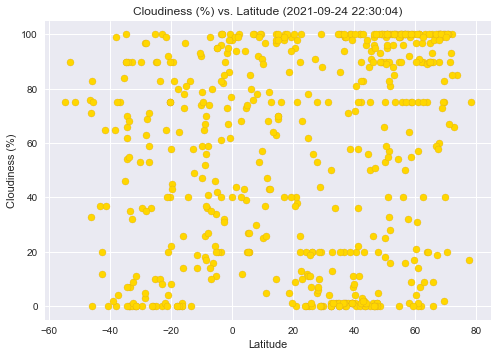
The purpose of this project was to utilize the Open Weather Map API and the citipy python package to find weather details with their respective latitude and longitude coordinates to discover trends between the degrees of latitude and a specified "x": temperature, humidity, wind speed, and/or cloudiness.
Random latitude and longitude combinations were first created using the numpy random function, then the coordinates were used to search for the city name that is located in the citipy library. Then, those city names were input into the API endpoint to collect a list of various weather details for each city (see: Data). After those lists were created, matplotlib was used to plot each of the details into graphs. Click here to view the jupyter notebook.
Visualizations
Click on a visualization above to see more details.