Cloudiness vs. Latitude
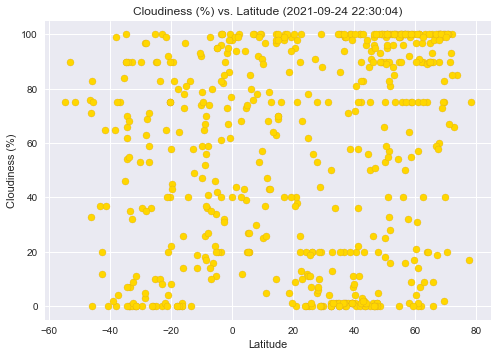
This scatter plot is analyzing the correlation between the latitude of a city and the percentage of cloudiness for that location on a given day. The graph suggests that there may not be a significant relationship between these two factors, since they do not follow a line, and show no apparent pattern. This shows that the percentage of cloudiness cannot be determined by where you are, whether in the southern or northern hemisphere.
Visualizations
Click on a visualization above to see more details.