Max Temperature vs. Latitude
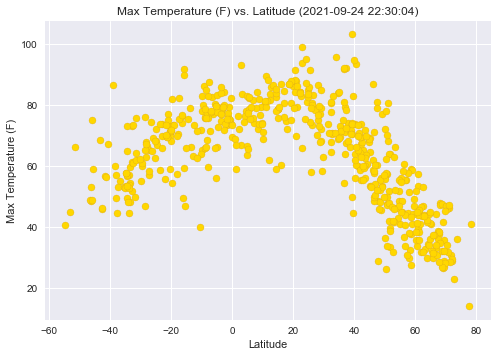
This scatter plot is analyzing the correlation between the latitude of a city and the max temperature in degrees Fahrenheit for that location on a given day. The graph suggests that there is a relationship between these two factors, since they fall along the same line. It shows that as you move from -60 to 20 degrees latitude, the temperature increases from 40 to 100 degrees F, and as you move from 20 to 80 degrees latitude, the temperature decreases from 100 to below 0 degrees F. This suggests that the equator (at 0 degrees latitude) is where the temperature is the hottest.
Visualizations
Click on a visualization above to see more details.